Can a Doodle Prove a Point? The Surprising Logic of Diagrams
The Day Euler Drew Circles
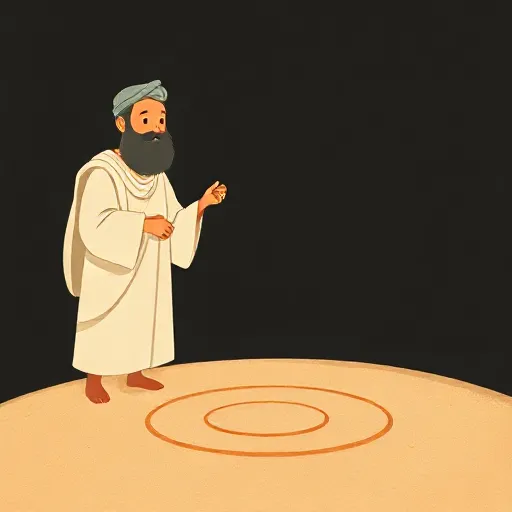
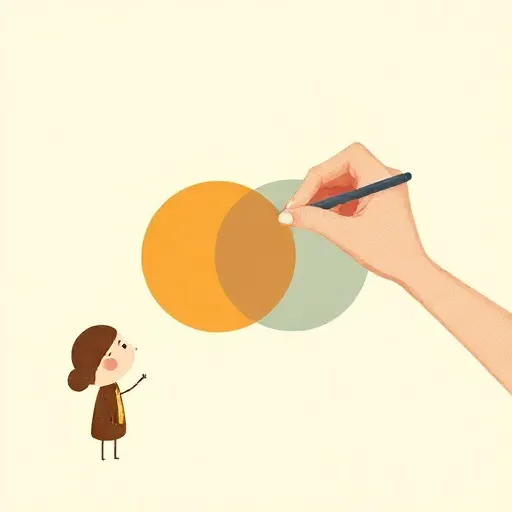
Leonhard Euler (1707–1783) stared at a slip of paper. He needed to check an argument, but instead of writing sentences, he drew two circles. One circle inside the other meant “All A are B.” Two separate circles meant “No A is B.” If you can see how the circles sit, you can see whether the conclusion follows. It felt like magic: reasoning without words.
Euler’s circles were a diagrammatic reasoning tool. For centuries, people had used drawings to think through problems—maps, geometry sketches, even doodles in the margin. But Euler was one of the first to show that a system of circles could do the work of a logical argument. He could solve syllogisms—arguments with two premises and a conclusion—by just drawing the circles. In one example, if all A are B and all C are A, you can simply see that C is inside B. The drawing makes it obvious.
But there was a catch. When Euler tried to draw “Some A is B,” he drew two circles partly overlapping. That seemed natural: part of A lies inside B, so something is in both. Yet looking at the same diagram, you could also see “Some A is not B” and “Some B is not A.” The picture said more than he intended. Euler knew something was off. He even introduced a star symbol to mark non-empty regions, but the crisp clarity of containment was lost. The diagram had become ambiguous.
Venn’s Shading Trick

John Venn (1834–1923) looked at Euler’s circles and spotted a deeper flaw. If a set was empty—for instance, if nothing was in A—Euler’s system couldn’t show that while also saying “All A are B.” The two statements are consistent (if A is empty, it’s true that all its members are in B and also true that none are). But you can’t draw a circle inside another and also separate them. Euler’s method forced you to pick one picture, locking out other possibilities.
Venn’s fix was ingenious. Instead of drawing exactly the relation that you knew, he started with a primary diagram that showed all possible overlaps among the circles—every region visible, with no commitment. Then he added shading to signal emptiness. Shading a region meant “there’s nothing in here.” So to represent “No A is B,” you shade the overlap area; to say “All A are B,” you shade the part of A outside B. With shading, you could draw “All A are B” and “No A is B” together by shading the whole A circle, which then tells you “Nothing is A.” The diagram became flexible.
Venn’s system could represent partial knowledge elegantly. But surprisingly, he didn’t tackle existential statements like “Some A is B.” You might think you could just put a mark in the overlap region, but Venn left that puzzle open. His diagrams needed another symbol.
Peirce Adds X’s and Lines
Charles Sanders Peirce (1839–1914), an American philosopher and logician, admired Venn’s work but wanted more. He aimed to handle not only “some” statements but also disjunctions—“either this or that.” Peirce replaced Venn’s shading with the symbol ‘o’ for emptiness, introduced ‘x’ for existential commitment (“there is something here”), and drew lines connecting o’s and x’s to mean “or.” Suddenly a single diagram could say complex things like “Either all A are B and some A is B, or no A is B and some B is not A.” No earlier system could pack so much into one picture.
But there was a price. A Peirce diagram could look like a tangled map of dots and lines. Reading it required knowing a handful of conventions, and the visual simplicity of Euler’s circles was gone. Peirce himself admitted the “great complexity” of his pictures. He also tried to set up transformation rules—rules for how you could change one diagram into another, like the rules of algebra. For example, you could erase an ‘x’ from a shaded region, because if a region is empty, nothing is there. He proposed six such rules, but he suspected they might be incomplete. Peirce lacked the modern distinction between syntax (what counts as a well-formed diagram) and semantics (what a diagram means) to prove his rules were correct. The dream of a diagrammatic formal system—one as rigorous as any symbolic logic—was still unfinished.
When Diagrams Become Formal Proofs
For most of the 20th century, logicians assumed that real proofs must be made of sentences. Diagrams were seen as helpful sketches, not part of the proof itself. Then Sun-Joo Shin, in 1994, showed that this prejudice wasn’t justified. She revised Peirce’s diagrams into two systems—Venn‑I and Venn‑II—and gave them a precise syntax and semantics. She proved the systems were sound (every provable argument is valid) and complete (every valid argument is provable), exactly the standards used for symbolic logic.
This was a breakthrough. It meant you could have a rigorous, formal logic built out of circles, shadings, crosses, and lines. The logical concepts—validity, consequence, consistency—aren’t locked inside words. They’re about information, however you represent it. Soon, computer programs like Hyperproof used mixed systems of sentences and diagrams to teach logic, treating diagrams as genuine proof symbols. Students could drag and drop diagram pieces to build proofs, and automated theorem provers sometimes used diagrams to speed up search. The barrier between “real logic” and “just pictures” had been torn down.
The work showed that diagrams can be as logically trustworthy as formulas. But there’s still a catch: not all diagram systems are equal, and their spatial nature can mislead. To see why, let’s go back to ancient geometry, where diagrams were used in a very different way.
Euclid’s Diagrams: Not Just Pretty Pictures
Euclid (around 300 BCE) wrote the Elements, the most famous geometry textbook ever. His proofs come with diagrams of triangles, circles, and lines. For centuries, people thought Euclid’s diagrams were just illustrations—nice to look at but not logically necessary. In the 1900s, mathematicians argued that a rigorous proof couldn’t depend on a picture, because pictures can be inexact and misleading.
Then the philosopher Ken Manders looked carefully and noticed something surprising. Euclid only ever used what Manders called co‑exact properties of a diagram—properties that stay the same even if you stretch or wiggle the drawing a bit. For instance, whether one angle lies inside another is a co‑exact property; it doesn’t depend on the precise measurement. But Euclid never concluded that two lengths were equal just because they looked equal in the diagram—those are exact properties, and they require a separate argument in the text. By sticking to co‑exact features, Euclid’s diagrams functioned as a controlled, systematic part of the proof method.
Manders’ insight sparked a wave of formalization. Two systems, FG and Eu, were built to capture Euclid’s diagrammatic logic with modern precision. In these systems, diagrams are formal objects with rules for constructing them and extracting general information. For example, in a proof about triangles, you can see from the diagram that a certain angle is contained within another—and because that containment is co‑exact, it holds for all similar triangles, not just the one you drew. Diagrams became part of the proof’s syntax, just like symbols in an equation.
Why Pictures Can Trick You (and Why That’s Okay)
Diagrams use space to represent relationships—containment, overlap, connection. That’s their power, but also their weakness. Spatial constraints in the plane can force a diagram to show more than you intend. A famous example comes from topology: Helly’s Theorem says that if every group of three among four convex regions overlaps, then all four must share a common intersection. In an Euler diagram, if you have three statements saying that different triple intersections are non‑empty, the diagram will inevitably show a quadruple overlap—even if no such overlap follows logically. The picture makes you “see” a conclusion that isn’t valid.
This isn’t just a quirk of circles. Many diagram systems suffer from similar limits because drawings live in a two‑dimensional space that has its own laws. A graph that can’t be drawn without crossing lines, for instance, might lead you to infer a relationship that doesn’t exist. So diagrams are not flawless; they can be incorrect if not used carefully.
But that doesn’t make them second‑class thinkers. It means we need to understand their rules, just like we learn grammar for sentences. When you use a map to navigate, you know that a flat drawing of a round Earth distorts some distances. You use it anyway, and you adjust. The same is true of logical diagrams. Once we formalize them, we know exactly when they’re reliable and when they might mislead.
Today, diagrams help biologists model cell cycles, physicists picture quantum processes, and chemists organize elements in the periodic table. They’re not just decoration—they’re tools of reasoning. The centuries‑long journey from Euler’s simple circles to Shin’s formal proofs has revealed that thinking with pictures is not second‑rate. It’s just thinking, done differently. And that opens a door: you don’t have to choose between words and pictures. You can use both, and a good reasoner knows when to switch.
Think about it
- If you could draw a perfect diagram that made a conclusion seem instantly obvious, would you trust it more than a long sentence? Why or why not?
- Why might a map sometimes mislead you even if every street is drawn correctly? (Think about what the map has to leave out.)
- When you solve a math problem by drawing a picture, do you think the picture is doing the reasoning, or is your brain doing all the work? Could it be both?